
Introduction
The COVID-19 crisis is affecting countries all over the world. This blog post with the associated Jupyter Notebook will look at different measures of how bad the outbreak is across the world. Each metric will be displayed in a global choropleth map. Additionally, this exercise sets up repeatable code to use as the crisis continues and more daily data is collected.
Data Sources
The data used in this analysis is all open source data. The COVID-19 daily data has been provided from the European Centre for Disease Prevention and Control. This data source is updated daily throughout the crisis and can be used to update this exercise regularly. In addition to the COVID-19 data, global population data was used to provide per capita metrics. This data is from The World Bank.
Python Code Access
The python code and Jupyter Notebook used to generate these results can be found here.
Results
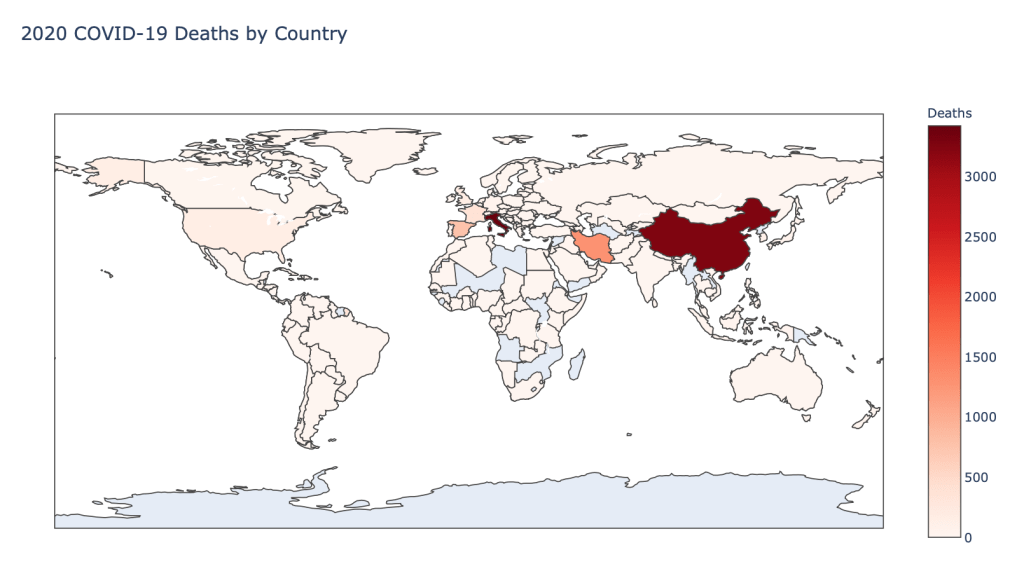
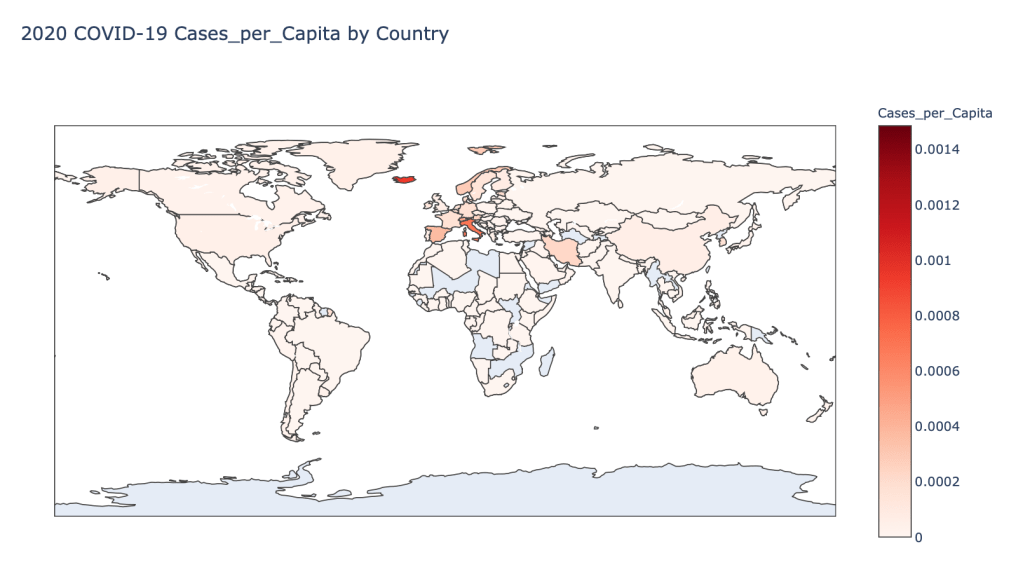
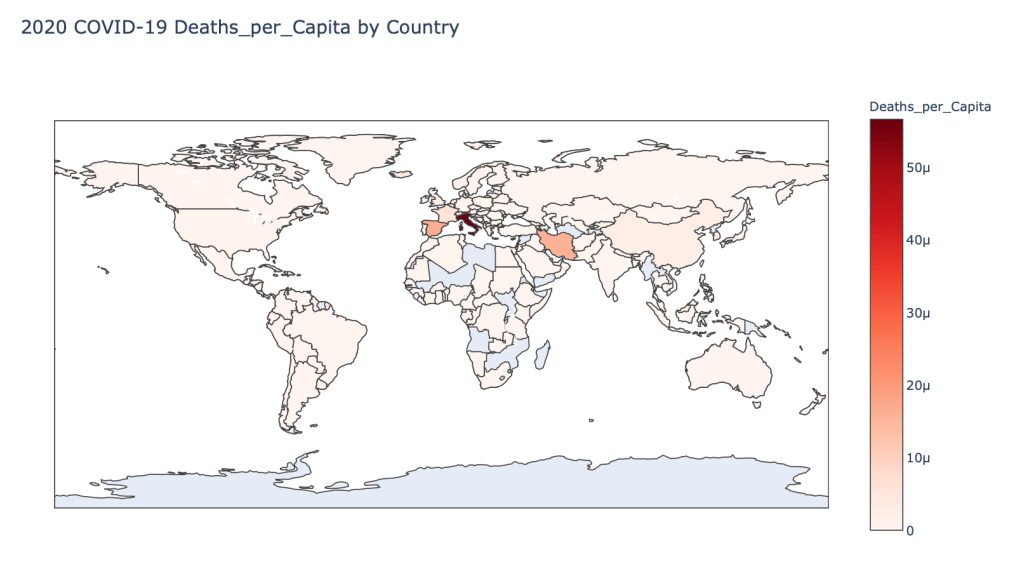
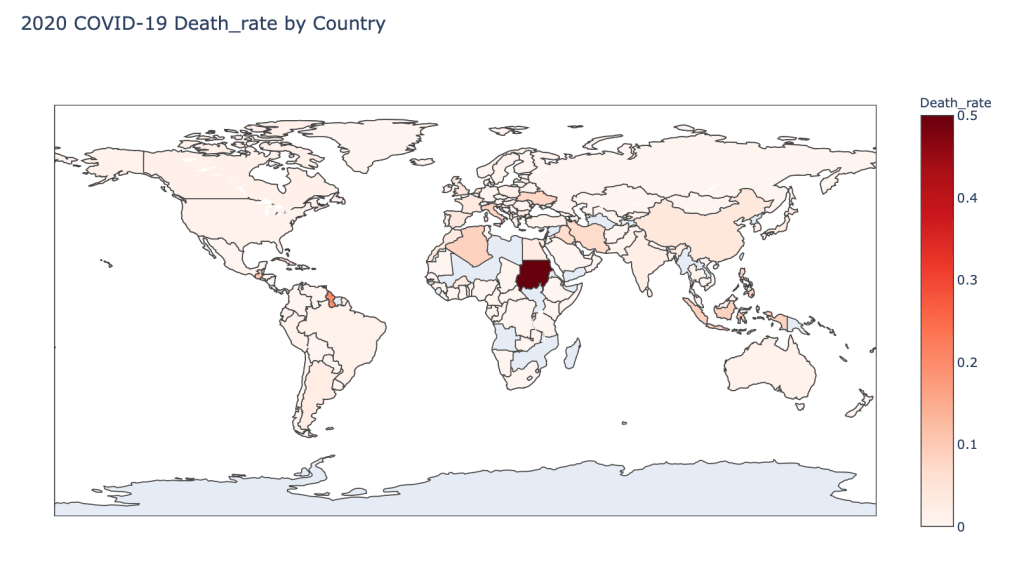
The main goal of this exercise was to create visualizations showing metrics for different countries across the globe. Therefore, each of five metrics are shown as global Choropleth maps. The five metrics that are displayed are:
- Number of 2020 Cumulative Cases
- Number of 2020 Cumulative Deaths
- 2020 Cases per Capita
- 2020 Deaths per Capita
- 2020 Death Rate
The maps shown here represent cases through 3/20/20. Although the code can be used to generate results for any date of 2020 prior to 3/20/20.

Conclusion
As you can see by looking at the various metrics, certain countries are handling the virus better than others. China has many cases, but in comparison to their overall population, the number of cases is not that high. Countries like Iceland and Italy have a high amount of cases per capita. Unfortunately, when looking a the death rates, places with less resources seem to have higher rates, such as Sudan or Guyana.

[…] To begin, global results as of 3/20/20 can be found in previous blog. […]
LikeLike
[…] To begin, global results as of 3/20/20 can be found in a previous blog. […]
LikeLike
[…] Global Results as of 3/20/20 […]
LikeLike
[…] Global Results as of 3/20/20 […]
LikeLike
[…] Global Results as of 3/20/20 […]
LikeLike
[…] Global Results as of 3/20/20 […]
LikeLike
[…] Global Results as of 3/20/20 […]
LikeLike
[…] Global Results as of 3/20/20 […]
LikeLike
[…] Global Results as of 3/20/20 […]
LikeLike
[…] Global Results as of 3/20/20 […]
LikeLike
[…] Global Results as of 3/20/20 […]
LikeLike
[…] Global Results as of 3/20/20 […]
LikeLike
[…] Global Results as of 3/20/20 […]
LikeLike
[…] Global Results as of 3/20/20 […]
LikeLike
[…] Global Results as of 3/20/20 […]
LikeLike